Gage R & R Full Example with ProcessMA
We start by looking into the setup of the example. The data contains:
- Three operators: 1, 2, and 3.
- Three trials: 1, 2, and 3.
- Ten parts: 1 through 10.
This means 90 responses: each operator measures each part 3 times (3 operators x 10 parts x 3 times = 90 responses).
Here's a snapshot of the dataset (first 30 rows):
To perform a Gage R&R in ProcessMA, select GageRnR (Crossed) under the option Gage RnR as shown in the screenshot below.
The following fields should be selected accordingly for the study:
Study variation: 6 * the standard deviations of each source of variation
Hit OK.
The first table of results showcases the ANOVA output. Recall from the ANOVA significance tests that we are looking into two or more factors and their interactions; in this example: part, operator, and the interaction between part and operator. The Gage R&R study conducts an Analysis of Variance (ANOVA) to attribute the total variation in the study to the various sources of variation part-to-part, operator, and operator by part. A p-value less than 0.05 (generally acceptable level of risk, also called Alpha risk) indicates statistically significant difference.
For this study, Part (or part-to-part) and the Operator*Part interaction are significant while Operator on its own is not.
The second table from the study showcases the various sources of variation.
In this example, the overall %StudyVar is 42.42%. Industry benchmarks for Total Gage R&R are as follows:
- Less than 10% is an excellent measurement system
- 10% to 30% is a acceptable measurement system
- Greater than 30% is an unacceptable system
This study is therefore, unacceptable in terms of total variation and should be improved.
Also notice the individual sources of variation, specifically with regards to Repeatability and Reproducibility.
Repeatability is the difference in measurements when the same individual using the same device takes several measurements of the same object within a short period of time. In repeatability, we're looking for variations related to:
- Same operator
- On the same part
- At the same location on the part
- Using same devise
- Under the same condition of use
- Over a short period of time
Reproducibility is the difference in measurements when many individuals using the same device and method take several measurements of the same sample within a short period of time. In reproducibility, we're looking for variations related to:
- Different operators
- The same measuring instrument
- The same method
- At the same location on the part
- Under the same conditions of use
- Over a short period of time
Variation Study Plots
The resulting Gage R&R study also produces a set of plots in ProcessMA. Let's have a look at each one of them separately.
Bar Chart Components of Variation
It showcases the breakup of the total variation. These bars should match with the % in the second table discussed above.
Dot Plots by Operator
This simple dot plot shows the actual measures taken by each operator. This view can provide a quick reference with regards to each operator's variation in the study.
Dot Plots by Part
Similarly, this simple dot plot shows the actual measures taken for each part. This view can provide a quick reference with regards to each part's measurement variation in the study. For example, part 1 seems to be much tighter in variation than part 10.
Range Chart for Measurement by Operator
This range chart shows repeatability error by operator for each part. Recall that range is one of the measures of spread (or variability). In this example, operator 1 seems to have a special cause of variation in the repeatability aspect of his/her measurements. Consistency here means that the operator's measurements fall within the control limits.
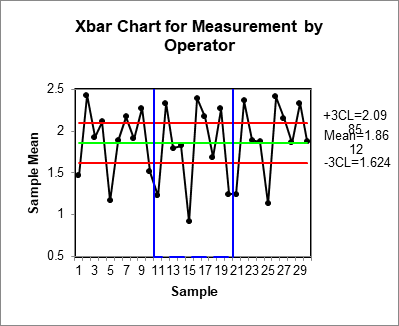
Xbar (average) Chart for Measurement by Operator
Each data point is the average for each part by operator, show the part to part variation. The control limits are based on range chart and represents the measurement system error.
- Most data points should fall outside the control limits
- Also, pattern between operators should be same; different patterns indicate operator*part interaction
Operator*Part Interactions Run Chart
Are the lines similar? If they coincide it means that the operators are measuring fairly equally. If not (if they are not parallels or they are crossed) there could be a sign that an operator's measurement is dependent on the part being measured. An extremely far apart point could indicate that an operator is adding bias to the whole system by frequently measuring too low or too high.


Comments
Post a Comment